The Inventory Prediction Crisis: Why 2026 is Make-or-Break for eCommerce Brands
In 2026, the inventory crisis facing eCommerce brands is real, measurable, and accelerating. According to a report published by the National Retail Federation, nearly 61% of eCommerce businesses identify inventory management as their single most pressing operational challenge, up from 53% just 18 months ago. This isn't a minor frustration; it’s the difference between brands that thrive and those that watch their margins evaporate.
The problem isn't that inventory management is complicated. It's that the tools most brands use, spreadsheets, manual forecasting, and historical averages, were designed for a different era. An era when demand was predictable, supply chains were stable, and competition moved at a human pace.
That era is gone.
The Brutal Economics of Bad Inventory Decisions
Let us walk you through the real cost of poor inventory forecasting. The numbers are staggering.
In January 2025, a mid-market apparel brand we spoke with had $340,000 worth of unsold inventory. Not all of it would sell. The seasonal items from Q4 2024 didn't move. The TikTok was over, and the inventory they'd been "safe" ordering was now dead weight.
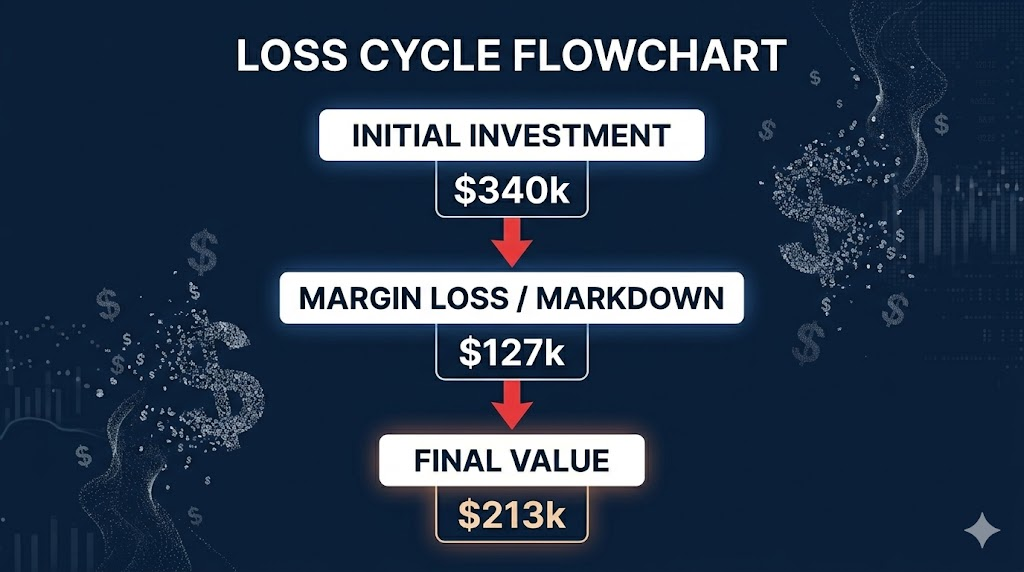
By the time they marked it down by 40% to 50%, took the hit, and paid to dispose of what wouldn't sell. That inventory cost them $127,000 in direct margin loss. In total, that’s a $340,000 investment that returned only $213,000 in value, certainly a 37% loss.
But overstocking isn't the only problem. Understocking is just as destructive.
During the same period, this brand experienced 8 stockout incidents where customer demand exceeded available inventory. In one case, a popular product variant ran out for 3 consecutive days, while another variant sat overstocked. During those 3 days, they left approximately $14,000 in sales on the table. Customers didn't wait; they bought from competitors.
Here's what the data says about customer behavior after a stockout. According to Forrester's 2025 eCommerce Consumer Study, 32% of customers will switch to a competitor after experiencing a single stockout. Another 21% will reduce their future purchases from the brand even if they don't switch entirely.
That's not a temporary loss. That's permanent damage to lifetime customer value.
For a typical mid-market store ($2M annual revenue), the math looks like this:
- Average customer lifetime value: $350
- Customers lost per stockout incident: 40-60
- Lost lifetime value per incident: $14,000-21,000
- Typical monthly stockout incidents: 4-8
- Monthly LTV loss from stockouts: $56,000-168,000
- Annual opportunity cost: $672,000-2,016,000
And that's just the direct customer loss. It doesn't include:
- The carrying costs of excess inventory (storage, insurance, labor, obsolescence)
- The working capital tied up that could be deployed elsewhere
- The operational complexity of managing fragmented inventory
- The markdown discounts needed to clear slow-moving stock
According to Deloitte's 2025 Supply Chain Report, carrying costs for eCommerce inventory average 25-32% annually. For a $300,000 inventory position, that means $75,000 to $96,000 in annual carrying costs. If your forecasting error causes you to hold 20% excess inventory, you're spending an extra $15,000 to $19,000 annually just to store stuff you don't need.
Why Current Forecasting Methods Are Fundamentally Broken
The root cause is that most eCommerce brands are still forecasting inventory using methods designed in the 1990s. They take historical sales data, adjust for seasonality, add a safety stock buffer, and call it a forecast.
This approach has three fatal weaknesses in 2026.
First: It assumes the past predicts the future.
Historical data was stable when markets were slow-moving. A seasonal pattern that repeated for 5 years probably would repeat in the sixth year. Trends moved gradually. Competition didn't shift overnight.
That’s not the case anymore. In February 2025, a beauty brand saw demand for a particular skincare product increase 340% in a single week, driven by a 15-second TikTok video posted by a micro-influencer with 2.3M followers. Their forecast, based on historical seasonal patterns and trend analysis from the previous month, predicted 8,000 units for the month. They actually sold 23,000 units in week two alone. They missed the forecast by 275% in a seven-day window.
This isn't unusual anymore. It's becoming normal. Viral moments, competitor actions, supply disruptions, and market shifts happen fast. History is increasingly unreliable as a predictor of future demand.
Second: Manual forecasting can't process complexity at scale.
Most brands don't have one product line. They have dozens, hundreds, or thousands of SKUs. Each SKU has different seasonality, shelf life, and supplier lead times. Each channel (Shopify, Amazon, TikTok Shop, marketplace) has different demand patterns.
A manual forecasting process, spreadsheet analysis, visual inspection, or gut adjustment might work for 50 SKUs. Try doing that for 500 SKUs across three channels, and you're either:
- Spending 60+ hours per week on forecasting (and still missing things)
- Foregoing granular SKU-level forecasts and using category-level averages (which obscure real demand)
- Using completely automated spreadsheet formulas (which are often wrong)
According to a 2025 study by the Inventory Management Institute, manual forecasting methods produce an average accuracy of 58% to 67%. For context, industry-leading demand sensing systems achieve 87% to 93% accuracy. The gap represents billions of dollars in inefficiency across eCommerce.
Third: Traditional methods can't incorporate real-time signals.
Demand doesn't wait for your monthly forecast review. A competitor drops their price on Tuesday. A news story mentions your category. Weather shifts. An email campaign performs better than expected. Marketplace algorithm changes favor your products.
Each of these events creates real demand signals in real-time. But if you're doing monthly forecasts in a spreadsheet, you won't incorporate that signal until next month's review. By then, the market has moved on.
How AI Demand Forecasting Actually Works
This is where artificial intelligence and machine learning change the game. Let us explain what's actually happening under the hood.
Traditional statistical forecasting relies on specific, pre-defined formulas. Time series analysis assumes demand follows a mathematical pattern that repeats. Seasonal decomposition breaks demand into trend, seasonal, and residual components. These are useful but limited. They can't discover patterns that the statistician didn't anticipate.
AI & ML are different. The algorithms don’t start with assumptions about how demand works. Instead, they learn from patterns in the data. They discover relationships that might not be obvious to human analysts.
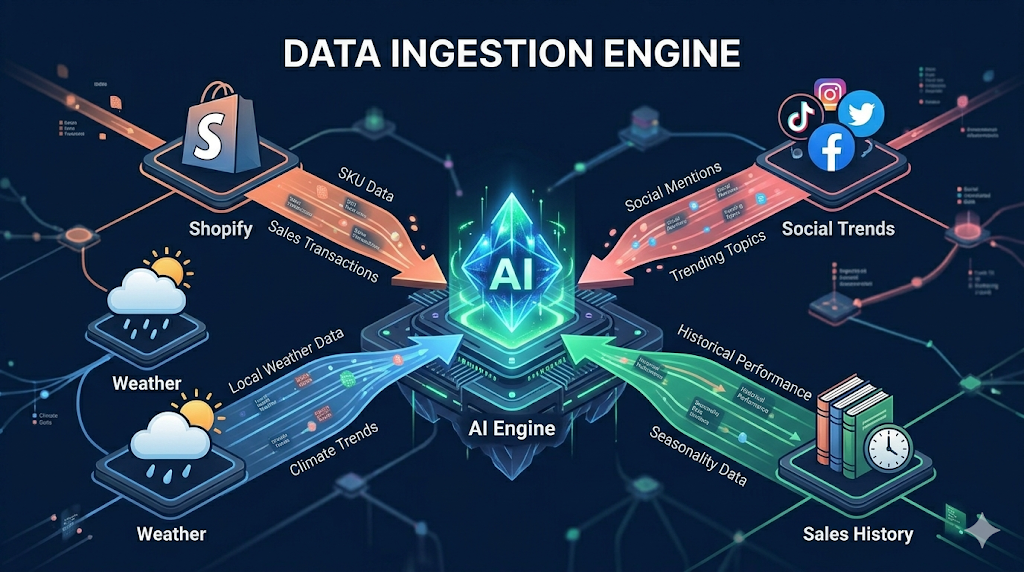
Here's concretely what that means: A good demand forecasting system ingests data from multiple sources continuously:
Historical Data:
- Your complete sales history (ideally 3-5 years)
- Inventory history
- Pricing history
- Promotional calendar
Current Operational Data:
- Real-time sales velocity (units sold per hour)
- Current inventory by location
- Purchase order timeline
- Supplier lead times
Channel Data:
- Shopify sales and inventory
- Amazon sales and FBA inventory
- TikTok Shop performance
- Marketplace activity
- Own website data
External Data:
- Seasonal calendars
- Weather patterns (relevant for certain categories)
- Competitor pricing (where available)
- Trend velocity (search volume, social media mentions)
- Calendar events and holidays
- News mentions of your category
From this raw data, the algorithm engineers "feature" signals that might predict demand. Examples include:
- Average daily sales in the last 7 days
- Percentage change in sales versus last week
- Percentage change versus the same week last year
- Seasonal index for this time of year
- Trend direction (accelerating or decelerating)
- Volatility (is demand stable or erratic)
- Days since last stockout
- Recent promotional activity
- Competitor price changes
- External event indicators
For a single SKU, the system might generate 500+ features. For a product that's sold for five years, across three channels, with 200+ variables tracked, that's enormous complexity. But that's exactly the complexity that machine learning was designed to handle.
The system then builds multiple prediction models for each SKU. Different models are good at different things:
- One model specializes in capturing seasonality
- One captures trend and momentum
- One captures anomalies and one-time events
- One captures external factor impacts
- One captures autocorrelation (how last week's demand predicts this week)
The system runs these models in parallel. For the specific forecast you're making (what will demand be for SKU X in week Y?), the system evaluates which model is most likely to be accurate. It weighs them accordingly. Sometimes the seasonal model is most important. Other times, current momentum dominates.
The result: A forecast that's accurate 87% to 93% of the time, with confidence intervals. This forecast is 95% confident versus 70%.
Compared to manual forecasting at 58% to 67% accuracy, you see why this matters. The accuracy gap directly translates to inventory decisions. Better accuracy means less overstock, fewer stockouts, better cash flow, and higher revenue.
The Real-World Impact: What Actually Happens When Brands Implement This
Theory is fine, but let me show you what actually happens in practice.
A fashion retailer with 520 SKUs implemented machine learning demand forecasting in Q3 2025. Their baseline:
- Forecast accuracy: 64%
- Overstock rate: 26%
- Stockout incidents: 12-14 per month
- Inventory carrying cost: $84,000 annually
- Lost revenue from stockouts: ~$240,000 annually
- Manual forecasting time: 14 hours per week
Implementation took two weeks (data connection, system setup, team training). The algorithm was trained for one week on their historical data. By week four, forecasts were appearing in the dashboard. By week eight, they had meaningful accuracy metrics.
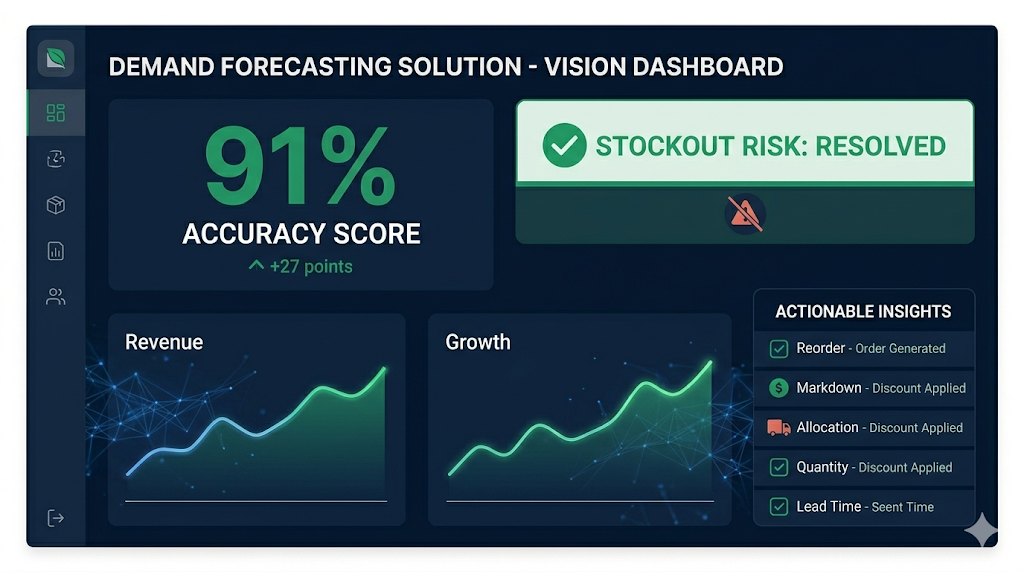
At the twelve-week mark (December 2025):
- Forecast accuracy: 91% (27-point improvement)
- Overstock rate: 4% (22-point improvement)
- Stockout incidents: 2 per month (85% reduction)
- Revenue from reduced stockouts: ~$198,000
- Manual forecasting time: 2 hours per week (12 hours freed up weekly)
- Total inventory reduction: 23% ($125,000 freed up as working capital)
- Inventory carrying cost: $58,000 annually ($26,000 savings)
Their net year-over-year improvement:
- Cost Savings: $26,000 carrying cost + 520 hours × $22/hour = $26,000 + $11,440 = $37,440
- Revenue Gains: $198,000 (reduced stockouts)
- Working Capital Freed: $125,000 (inventory reduction)
- Total First Year Benefit: $360,440
The investment in demand forecasting software (approximately $8,000 to 12,000 annually)? Paid for itself by month two.
But here's what's important: This benefit compounds. In year two, they don't lose momentum. The algorithm continues improving. They've freed up working capital to invest in growth. They have a more accurate inventory, so they can be more aggressive with marketing (knowing they can fulfill demand). The competitive advantage compounds.
A Second Example: Multi-Channel Complexity
Another client, a beauty brand selling on Shopify, Amazon (FBA), and TikTok Shop separately, had a different problem. They had decent single-channel forecasting, but no unified view.
The result: Simultaneous overstock on one channel and stockout on another. They'd oversell on TikTok while Shopify had 200 units sitting. No visibility into total demand across channels. No way to allocate inventory optimally.
After implementing unified demand forecasting (connecting all three channels):
- Unified forecast accuracy: 88%
- Overselling incidents: 0 (eliminated)
- Safety stock: Reduced 18% (less capital tied up)
- Labor hours: -16 hours per week
- Inventory turnover: Improved 24%
The unified view alone, seeing demand across all channels simultaneously, changed their inventory allocation strategy.
What to Look for in a Demand Forecasting Solution
Not all demand forecasting software is created equal. Here's what separates solutions that actually work from solutions that disappoint.
Native Integration with Your Channels
The software should connect directly to Shopify without manual data uploads. Automatic syncing of sales, inventory, and SKU data. Hourly or real-time updates so forecasts stay current. If you're selling on Amazon or TikTok, those connections should be built in, not an afterthought.
Why this matters: Manual data management creates delays. By the time you've exported from one system and imported it to another, the data is stale. Real-time integration means forecasts reflect yesterday's sales immediately.
Multi-Channel Consolidation
If you sell across multiple channels, you need a unified forecast, and not separate forecasts per channel that don't align. The system should aggregate demand signals across all channels and produce one forecast you can rely on.
Many brands find they can reduce total inventory by 15-20% just by getting visibility into total demand. They're not double-forecasting or creating buffers for uncertainty across channels.
Explainability
The forecast should show you why. "We're predicting 5,400 units this week because: 70% seasonal demand for this week, 15% upward trend momentum, 10% external factors (holiday approaching), 5% other."
If you see a forecast has changed 30% since yesterday, you should understand why. Did something break? Is there really new information? Or is it noise?
Explainability builds trust. And trust is necessary because you're making purchasing decisions based on these forecasts. You need to understand whether to override the system or trust it.
Accuracy Measurement and Improvement
The system should measure its own accuracy weekly and show you the improvement. You should see your forecast accuracy trending upward as the system trains on your data. If accuracy flatlines, something's wrong, and you should investigate.
You should also be able to see which product categories or time periods have better vs. worse accuracy. Maybe seasonal products forecast better than trend-driven products. Maybe you're consistently off during holiday seasons. Understanding these patterns helps you refine the system.
Custom Variables and Manual Input
Sometimes you know something the algorithm doesn't yet. You're launching a new marketing campaign. A celebrity mentioned your product. You're discontinuing a SKU. The system should let you input this information to improve forecasts.
Additionally, you should be able to upload custom data: supplier lead times, promotional calendar, and historical events. This helps the algorithm learn context that raw transaction data alone wouldn't capture.
Actionable Recommendations, Not Just Forecasts
A good system doesn't just predict demand. It recommends actions:
- Reorder point: When should you place a purchase order?
- Order quantity: How much should you order?
- Supplier selection: Which supplier should you use?
- Markdown suggestions: When should you discount slow-moving inventory?
- Allocation recommendations: How should you distribute inventory across channels?
These recommendations should come with confidence levels and expected outcomes. "We recommend ordering 1,200 units on Tuesday. This has 92% confidence and will keep you at 95% service level while reducing excess inventory."
Implementation Realistic Timeframe
Beware of vendors claiming you'll see results in weeks. Real demand forecasting requires training time. A realistic timeline:
- Week 1-2: Setup and integration
- Week 3-4: Algorithm training on your historical data
- Week 5-8: First forecasts appearing, initial accuracy metrics
- Week 9-12: Meaningful optimization, tangible business impact
- Month 4+: Continued improvement and compounding benefits
Brands that see results by week 4 typically have 2-3 years of clean historical data and relatively simple product catalogs. Brands with more complex situations or shorter histories might need 12-16 weeks to see full impact.
The Time to Make This Decision
Here's the blunt truth: In 2026, demand forecasting accuracy is becoming a competitive moat. Brands that forecast well can:
- Operate with 15-25% less inventory (freeing up cash)
- Avoid 50-60% of stockouts (keeping customers satisfied)
- Make smarter purchasing decisions (protecting margins)
- Allocate resources more efficiently (saving labor)
Brands that don't forecast well will continue to:
- Tie up capital in excess inventory
- Lose sales to stockouts
- Spend money on carrying costs and markdowns
- Waste hours on manual analysis
The gap between good forecasting and bad forecasting used to be a few percentage points. Now it's substantial. It's a competitive disadvantage you can't afford.
The good news: Implementing this isn't complicated. It's not expensive. It takes weeks, not months. And it starts paying back immediately.
If you're not forecasting accurately, now is the time to fix that.